Phase One Data
 |
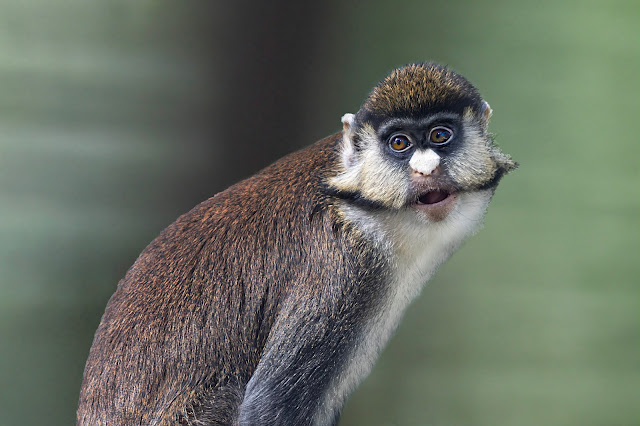
| Red-tailed monkey at the Oakland Zoo. |
Photos by Steven Gotz.
 |
| Ring-tailed lemur at the Oakland Zoo. |
Going over the data from Phase One has been surprisingly fun! It has been rewarding to see the data back up what I observed when the animals had the boxes. I am not super tech and number savvy, so my sister has been helping me with that.
In the above chart, you can see how many visits to each color of box both the lemurs and the red-tailed monkeys have made, and how those visits fluctuate for each day. It is important to note that for the lemurs, there are more animals and therefore more boxes than there are monkeys, and boxes for the monkeys. It is also possible that the lemurs used their sense of smell to aid them in choosing boxes, but interestingly they almost always chose to engage with yellow boxes first.
Red-tailed Monkeys:
The above graph and chart show the red-tailed monkeys visits to the boxes during Phase One. You can see that there is overall a clear increase in the visits to the blue boxes, while a decrease in visits to yellow boxes. On Day 4, they ended up making a lot of visits to the boxes, so there are more visits to the yellow boxes on that day compared to Day 3, but still proportionately much less visits to the yellow compared to the blue on Day 4.
First box interacted with:
Day One: Yellow box
Day Two: Blue box
Day Three: Yellow box
Day Four: Blue box
Above, I have kept track of which color box was the first to be engaged with by the monkeys throughout Phase One. As you can see, there's really not a pattern. This data will be interesting to compare with their Phase Two results.
Lemurs:
For Phase One with the lemurs, we can see a steady decrease in their visits to the yellow boxes. Interestingly, although their visits to the blue boxes increased on Day Two compared to Day One, they decreased the next day by three visits, and again by one visit the following days. I think perhaps they just became less excited about the boxes, and they had plenty of other yummy goodies in their large exhibit to snack on that are easier to obtain. The monkeys have a much smaller exhibit, so it's possible that is a factor.
The above line graph shows the amount of interactions with the boxes that the lemurs had throughout Phase One in twenty minute increments. Their engagement with the boxes also generally tapered off after the first 15 minutes, mirroring the monkeys. It is also interesting to see the dramatic change in interaction amounts per twenty minutes on Day One versus Day Three! It seems to me that their awareness of the boxes containing food increased after the first day, but their interest in engaging with the boxes did fluctuate.
First box interacted with:
Day One: Yellow box and blue box.
Day Two: Yellow box
Day Three: Yellow box
Day Four: Yellow box
So these results of the first boxes the lemurs interacted with are interesting. Remember, the yellow boxes are the empty ones. Although the lemurs interacted with the blue boxes significantly more than the yellow ones throughout Phase One, they consistently chose a yellow box to engage with first. You would think that if they were using their sense of smell to aid them in choosing the boxes, they would have always chosen a blue box first, but that was not the case. So maybe they actually did not use their sense of smell to help them with this task? Do they maybe really like the color yellow? It would be interesting to present them with new toy items, all identical save for being blue or yellow, and see which ones they prefer to interact with. (For Day One, two lemurs interacted with two different boxes at the exact same time, thus I counted both as the first interaction). Or, maybe this means nothing! We will see what Phase Two looks like for them.
 |
| Crowned lemur participant Horos as an infant. |
Now on to analyzing Phase Two!


Comments
Post a Comment